The till shows your sales. Visult shows the sales you lose.
Visult joins the security cameras already in your stores with your till data, and shows which store loses buyers at which hour and whether a change you made worked, without identifying anyone.
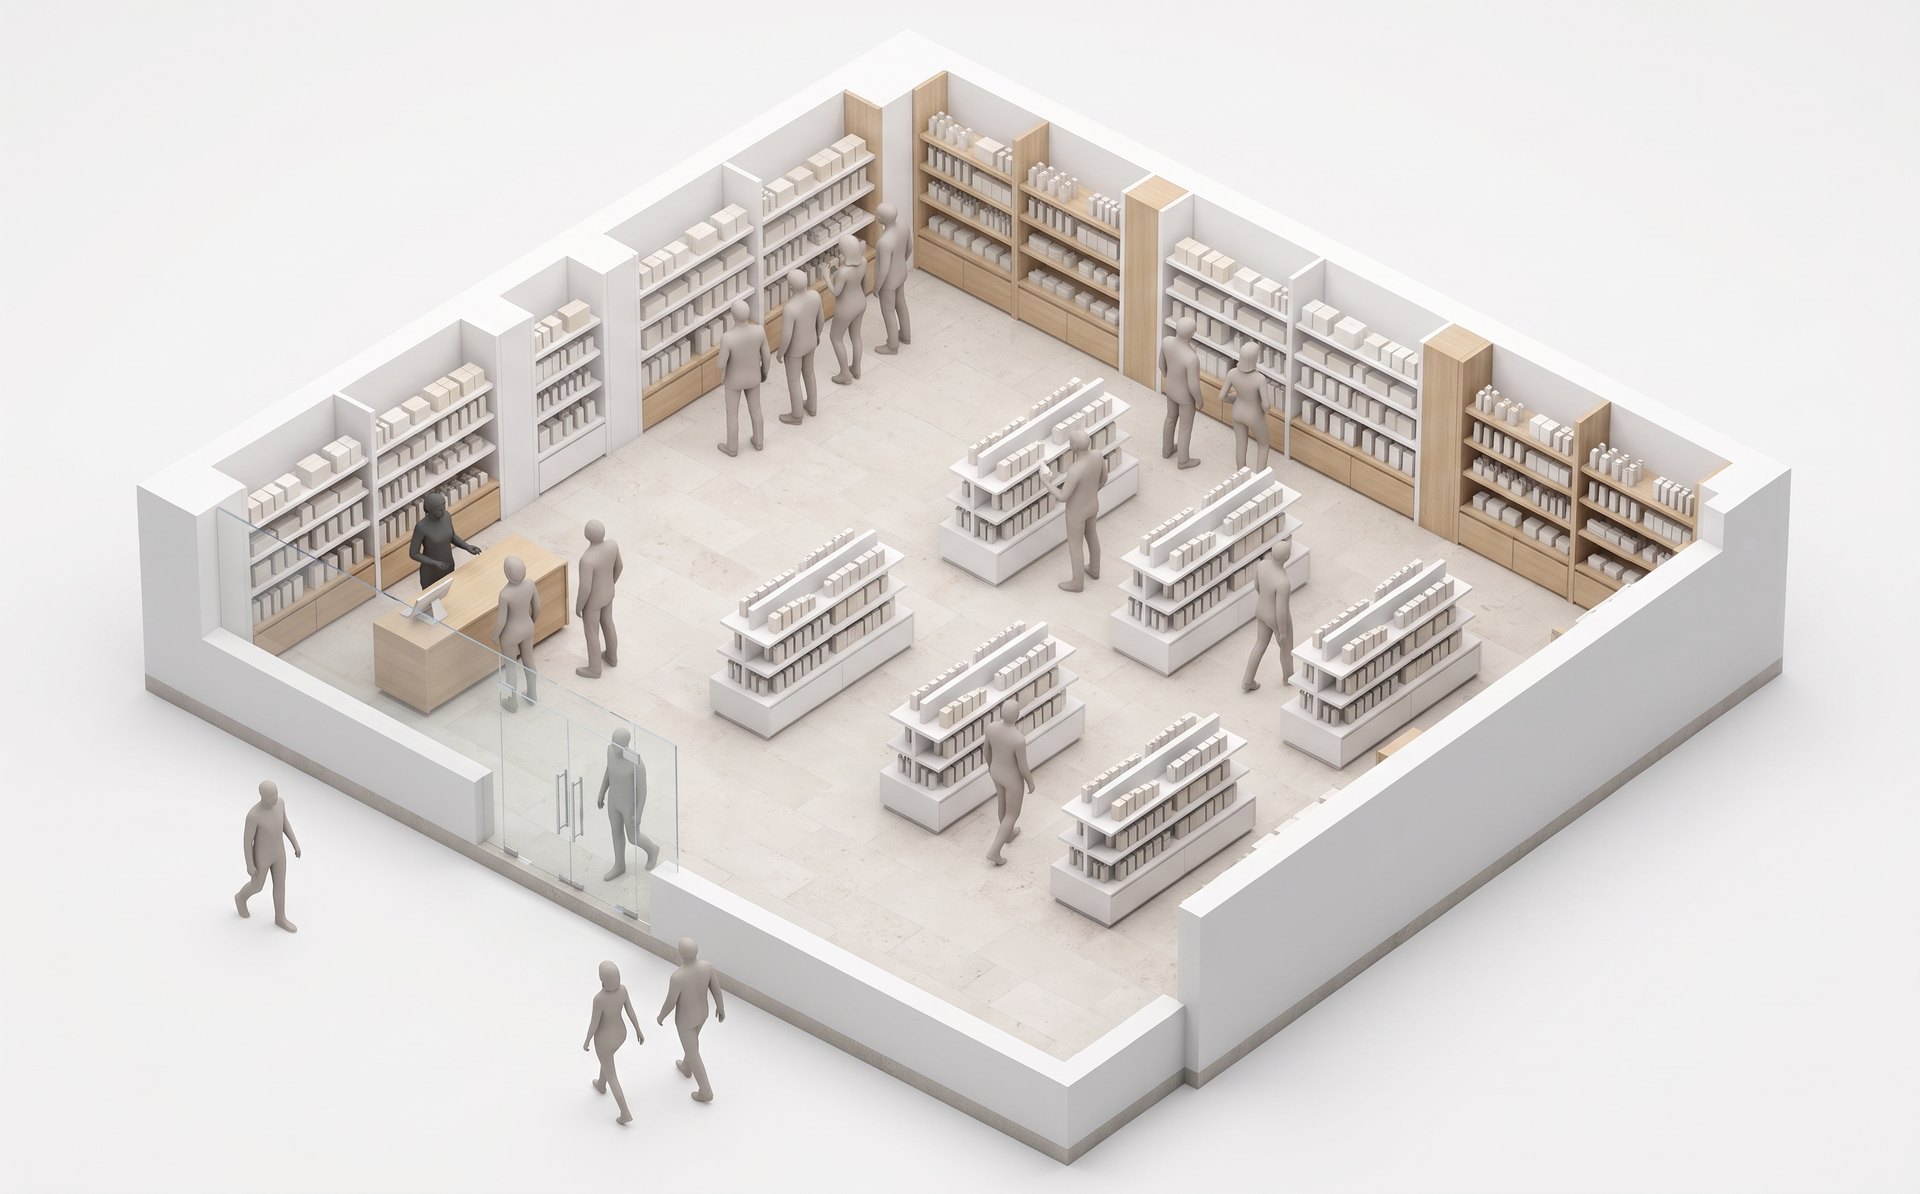
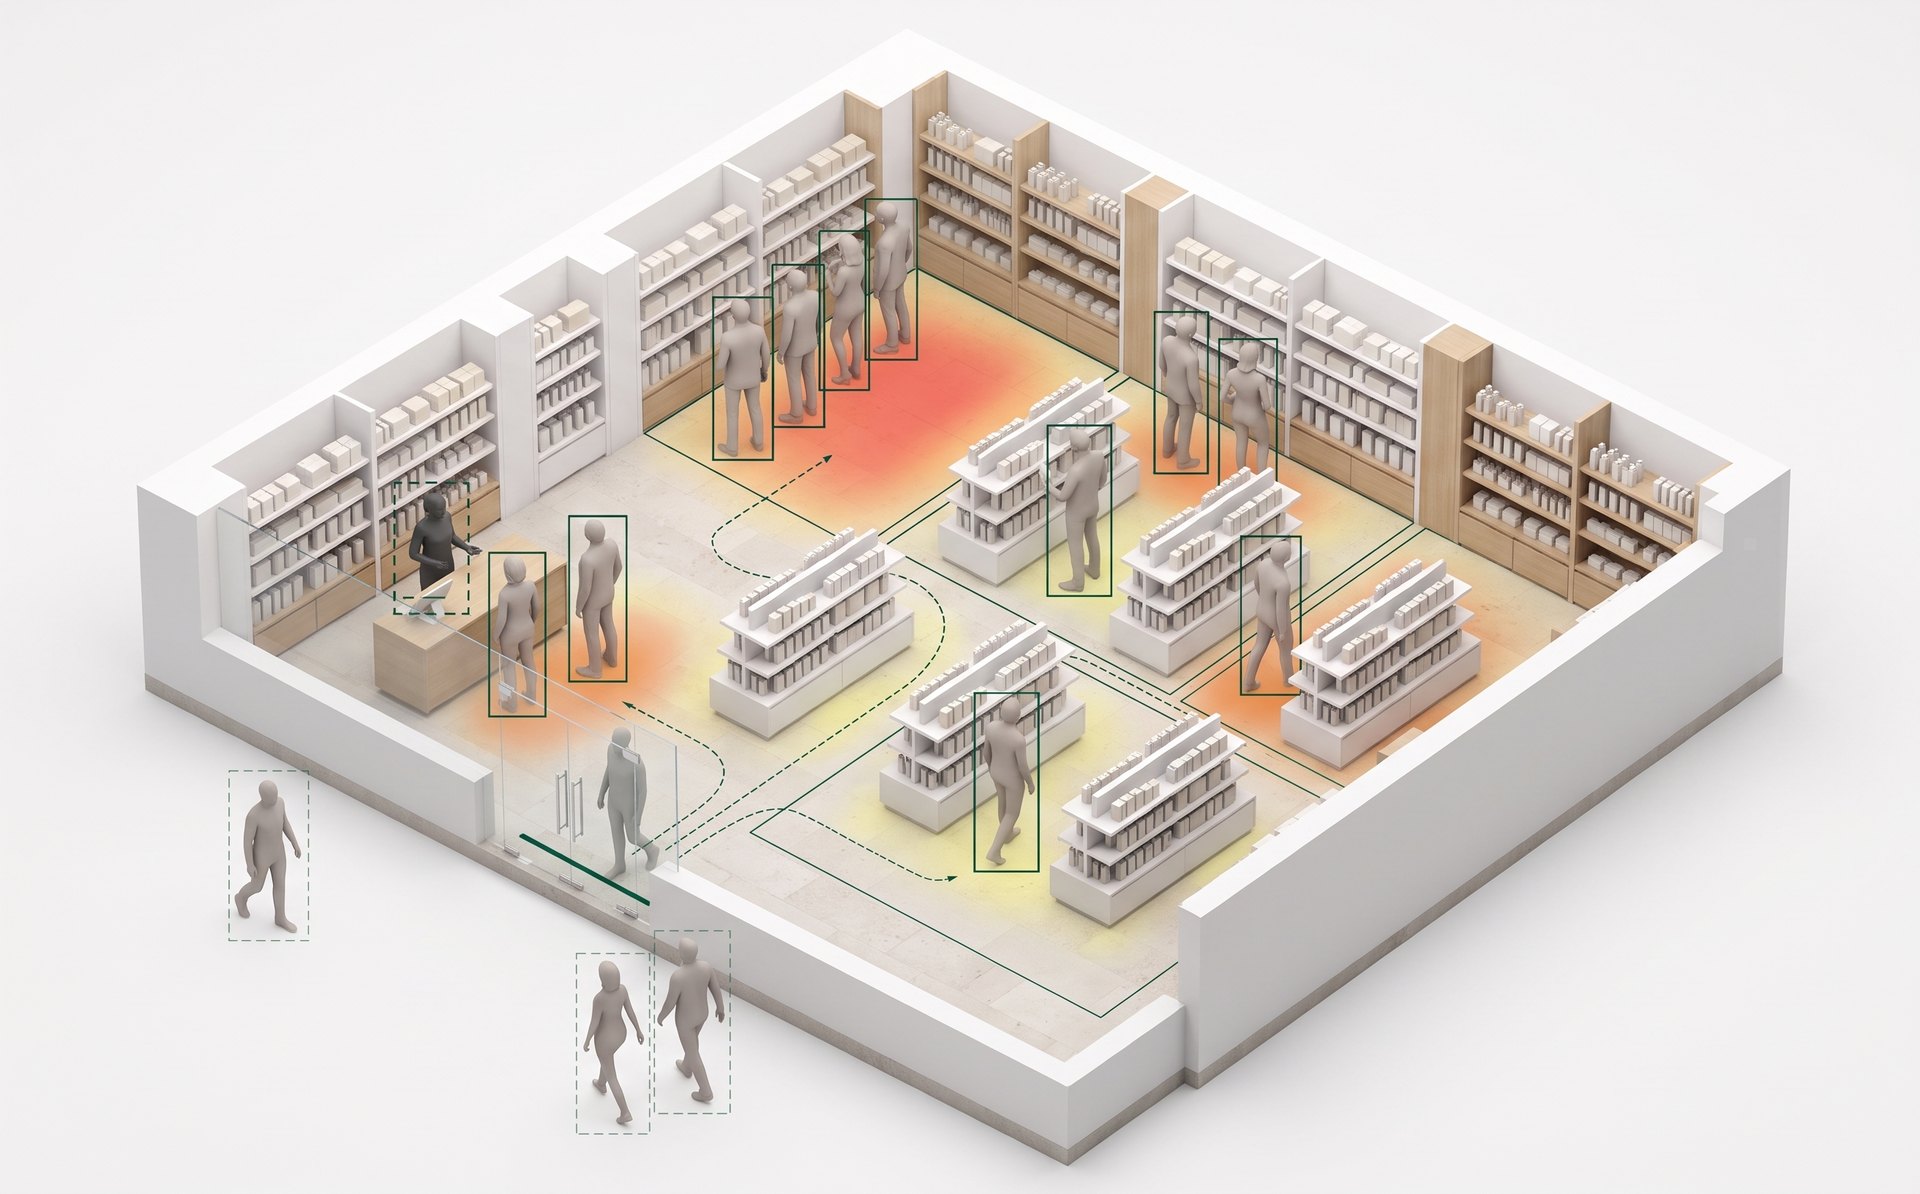
- Passed by
- 4,910
- 1 in 4 came in
- Came in
- 1,284
- 2 in 3 stopped
- Stopped in store
- 846
- 534 left without buying
- Bought
- 312
- 37% of stops
- Conversion
- 24%
- 26% last week
- Wait at the till
- 1 min 20 s
- 4 min at 17:00–19:00
What it means
534 people took an interest in a product and left without buying.
Most are lost between 17:00 and 19:00; in the same hours the wait at the till reaches 4 minutes.
Suggestion
Open a second till in these hours and compare the result with similar stores.
- Works with your existing cameras
- Till export received as a file
- No face recognition, no identification
The till only sees the people who buy.
The customer who walks in and leaves empty-handed, or gives up in the queue, never appears in a till report. That information stays in security recordings nobody watches.
Head office runs stores it cannot stand in: it sees the sales, not the lost sales.
What the till sees
What sold, when it sold, what was in the basket, which discount applied. Head office already reads this data.
What the camera records
How many people came in, where they stopped, how long they queued, how many left without buying. Today this sits as raw footage.
What the two show together
Visitor counts and receipts are matched by store and by hour. This shows which store loses buyers at which hour, an indicator till data cannot provide on its own.
Who it is for
Head offices of retail chains that run their own stores: operations and sales directors, regional managers. Visult compares stores with each other, so it is designed for chains with many stores.
Your cameras, your till, one page a week.
Visult brings two data sources your stores already have into one report.
-
Your cameras count
People coming through the door are counted hourly from the footage of the security cameras already in the store. Each camera is assessed in advance for whether it can count. No new counting sensor is needed.
-
Your till is matched
The receipt export from your till system is matched with visitor counts by store and by hour. It starts with a file transfer, without waiting for an integration project.
-
One page a week
Stores ranked by conversion, the hours when buyers are lost, and what changed after an action you took.
The dashboard tells you where to look this week.
When your head-office team signs in, it sees first the places that need attention, then the evidence and a suggestion, and last the result of the change it made.
- Visitors
- 38,420
- 37,300 last week
- Receipts
- 9,212
- 9,305 last week
- Conversion
- 24%
- 25% last week
- Wait at the till
- 1 min 20 s
- 1 min 05 s last week
Three places to look at this week
-
Store E, 17:00 to 19:00
Visitors rise, receipts do not.
Conversion 14%, chain average 24%. The wait at the till is 4 minutes in the same hours.
SuggestionOpen a second till in these hours.
-
Perfume department, all stores
High interest, low sales.
154 people stopped, 1 min 40 s on average. Its share of sales is 9%.
SuggestionCheck the price labels and the stock.
-
Store C, weekdays 10:00 to 12:00
Too many staff, few visitors.
6 visitors per member of staff; chain average 14. In the same store, 23 between 17:00 and 19:00.
SuggestionMove one person from the morning shift to the evening hours.
Evidence: Store E, hourly view
- Came in
- Receipts
17:00 to 19:00: visitors rise, receipts stay level
Stores by conversion
- Store A 31%
- Store B 27%
- Store C 24%
- Store D 21%
- Store E 14%
Did the last change work?
Till-front display, four weeks
It worked: conversion rose 1.8 points more than in the control stores.
- 6 test stores
- +2.1 points
- 6 control stores
- +0.3 points
-
Operations and sales directors
See stores ranked by conversion, and send staff hours and regional attention to where sales are being lost.
-
Regional managers
Follow their own stores hourly, and see before a store visit the hours when visitors rise and receipts do not.
-
Category and merchandising teams
See each department's engagement beside that department's sales; a department that draws interest without selling stands out.
Inside the store in numbers, from the door to the till.
Visult produces the following measurements from camera footage and till data. Every measurement is a total; none belongs to a single person.
Engagement by department
How many people stopped in which department, and for how long. The store is divided into departments; the areas that draw attention and the ones visitors pass without stopping are visible by department.
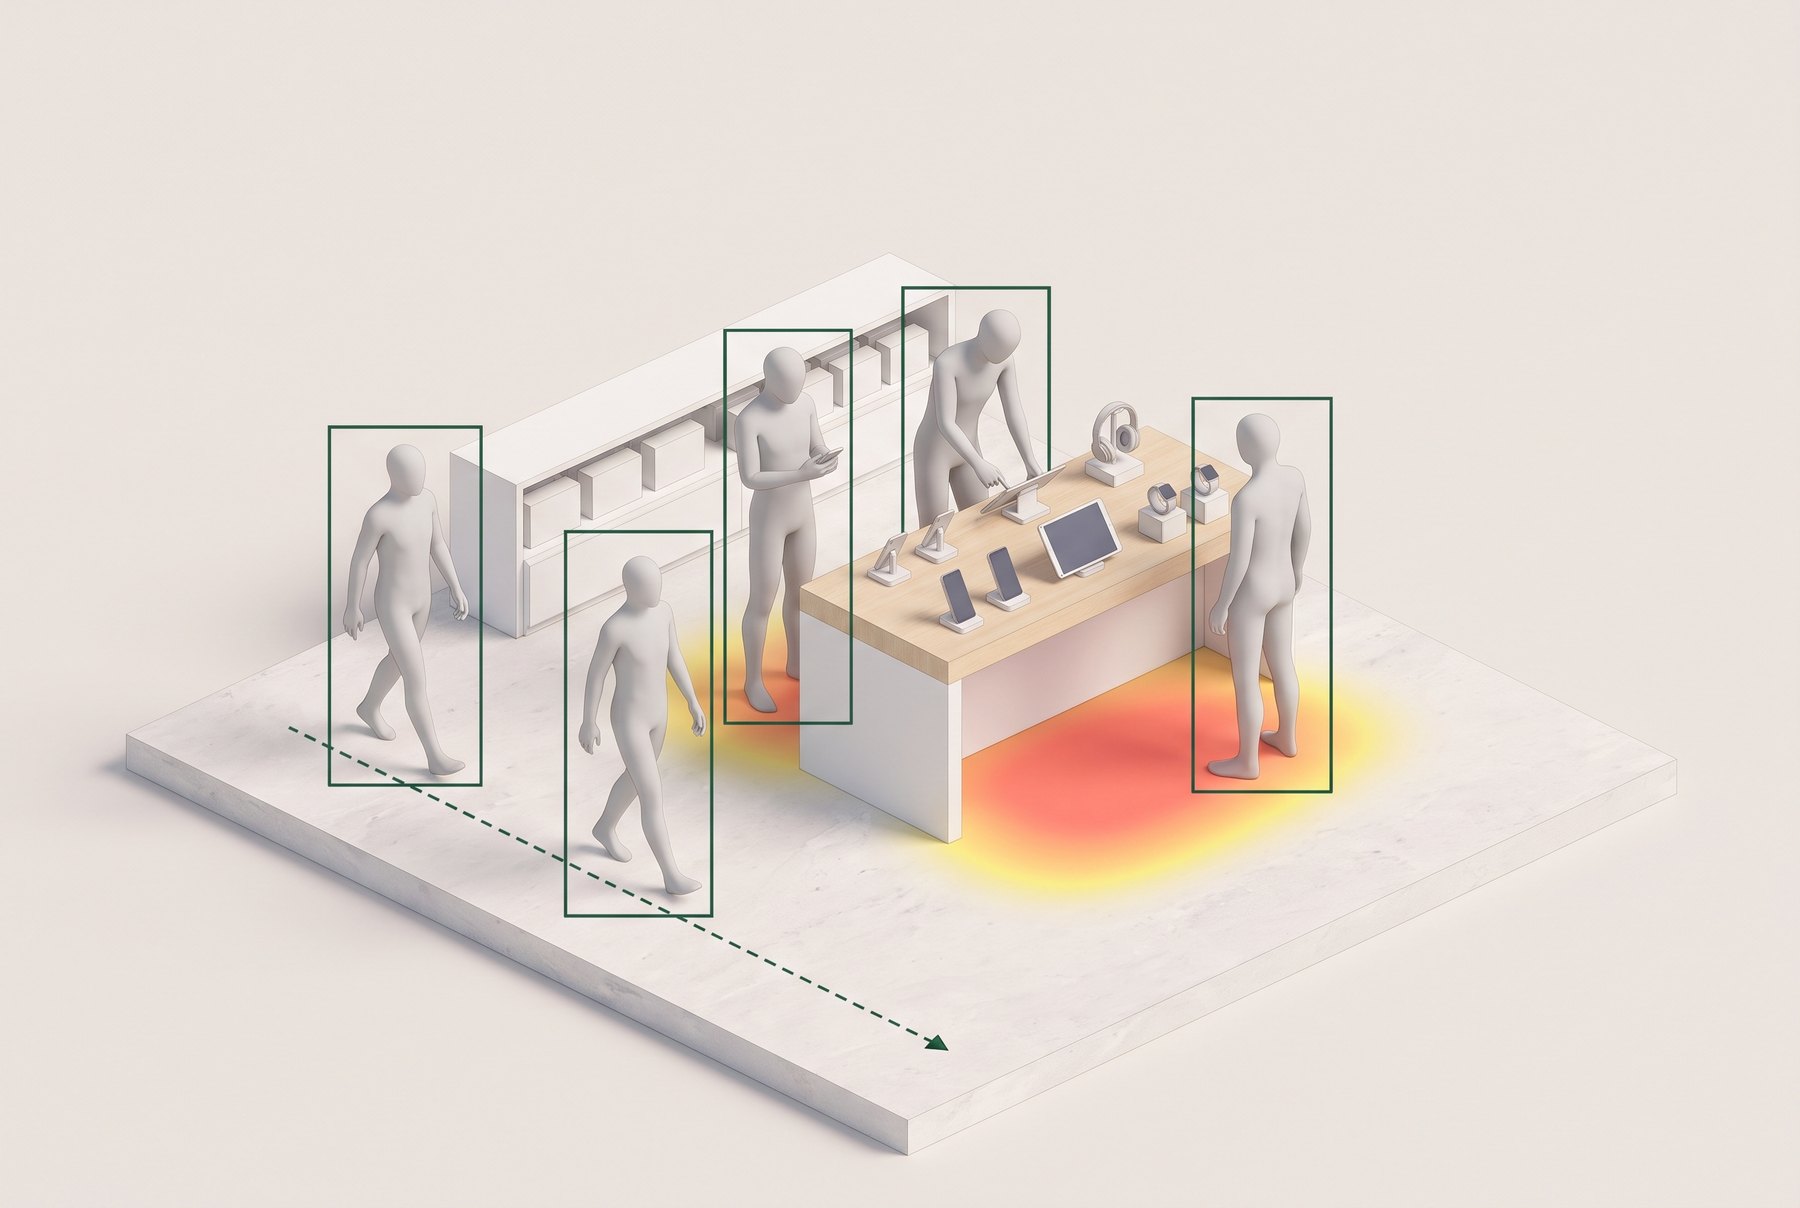
Stand: 3 stopped, avg 1 min 40 s
2 walked past
-
Staffing fit
Visitor and receipt counts are compared with the store's shift hours. It shows in which store and at which hour staff are short, and at which hour there are too many.
-
Checkout security
At self-checkouts, a suspected unscanned item is flagged as an event and reported to store management. No one is identified.
-
Footfall
The number of visitors entering and leaving through the door, by store and by hour.
-
Passers-by and capture rate
Of the people who pass the storefront, how many stop and how many come in.
-
Conversion
The share of visitors who bought, and sales per visitor; calculated by matching visitor counts with till receipts.
-
Engagement time
How long visitors stay in the defined areas, grouped into time bands.
-
Heat map
The areas of the store where movement concentrates and where it stays thin, visible at a glance.
-
Occupancy
The number of people in the store at the same time, and how it changes through the day.
-
Queue length
The length of the queue at the till, by hour.
-
Staff kept out of counts
Staff are excluded from visitor counts. Individual staff are not evaluated.
-
Comparison across stores
The same measurements side by side for all stores: by store, day and hour.
Proof, not counts.
The effect of a stand or display is mostly measured by sales today. A sales figure does not show how many people stopped at that stand. Visult makes this step before the sale visible and sets it beside the sales.
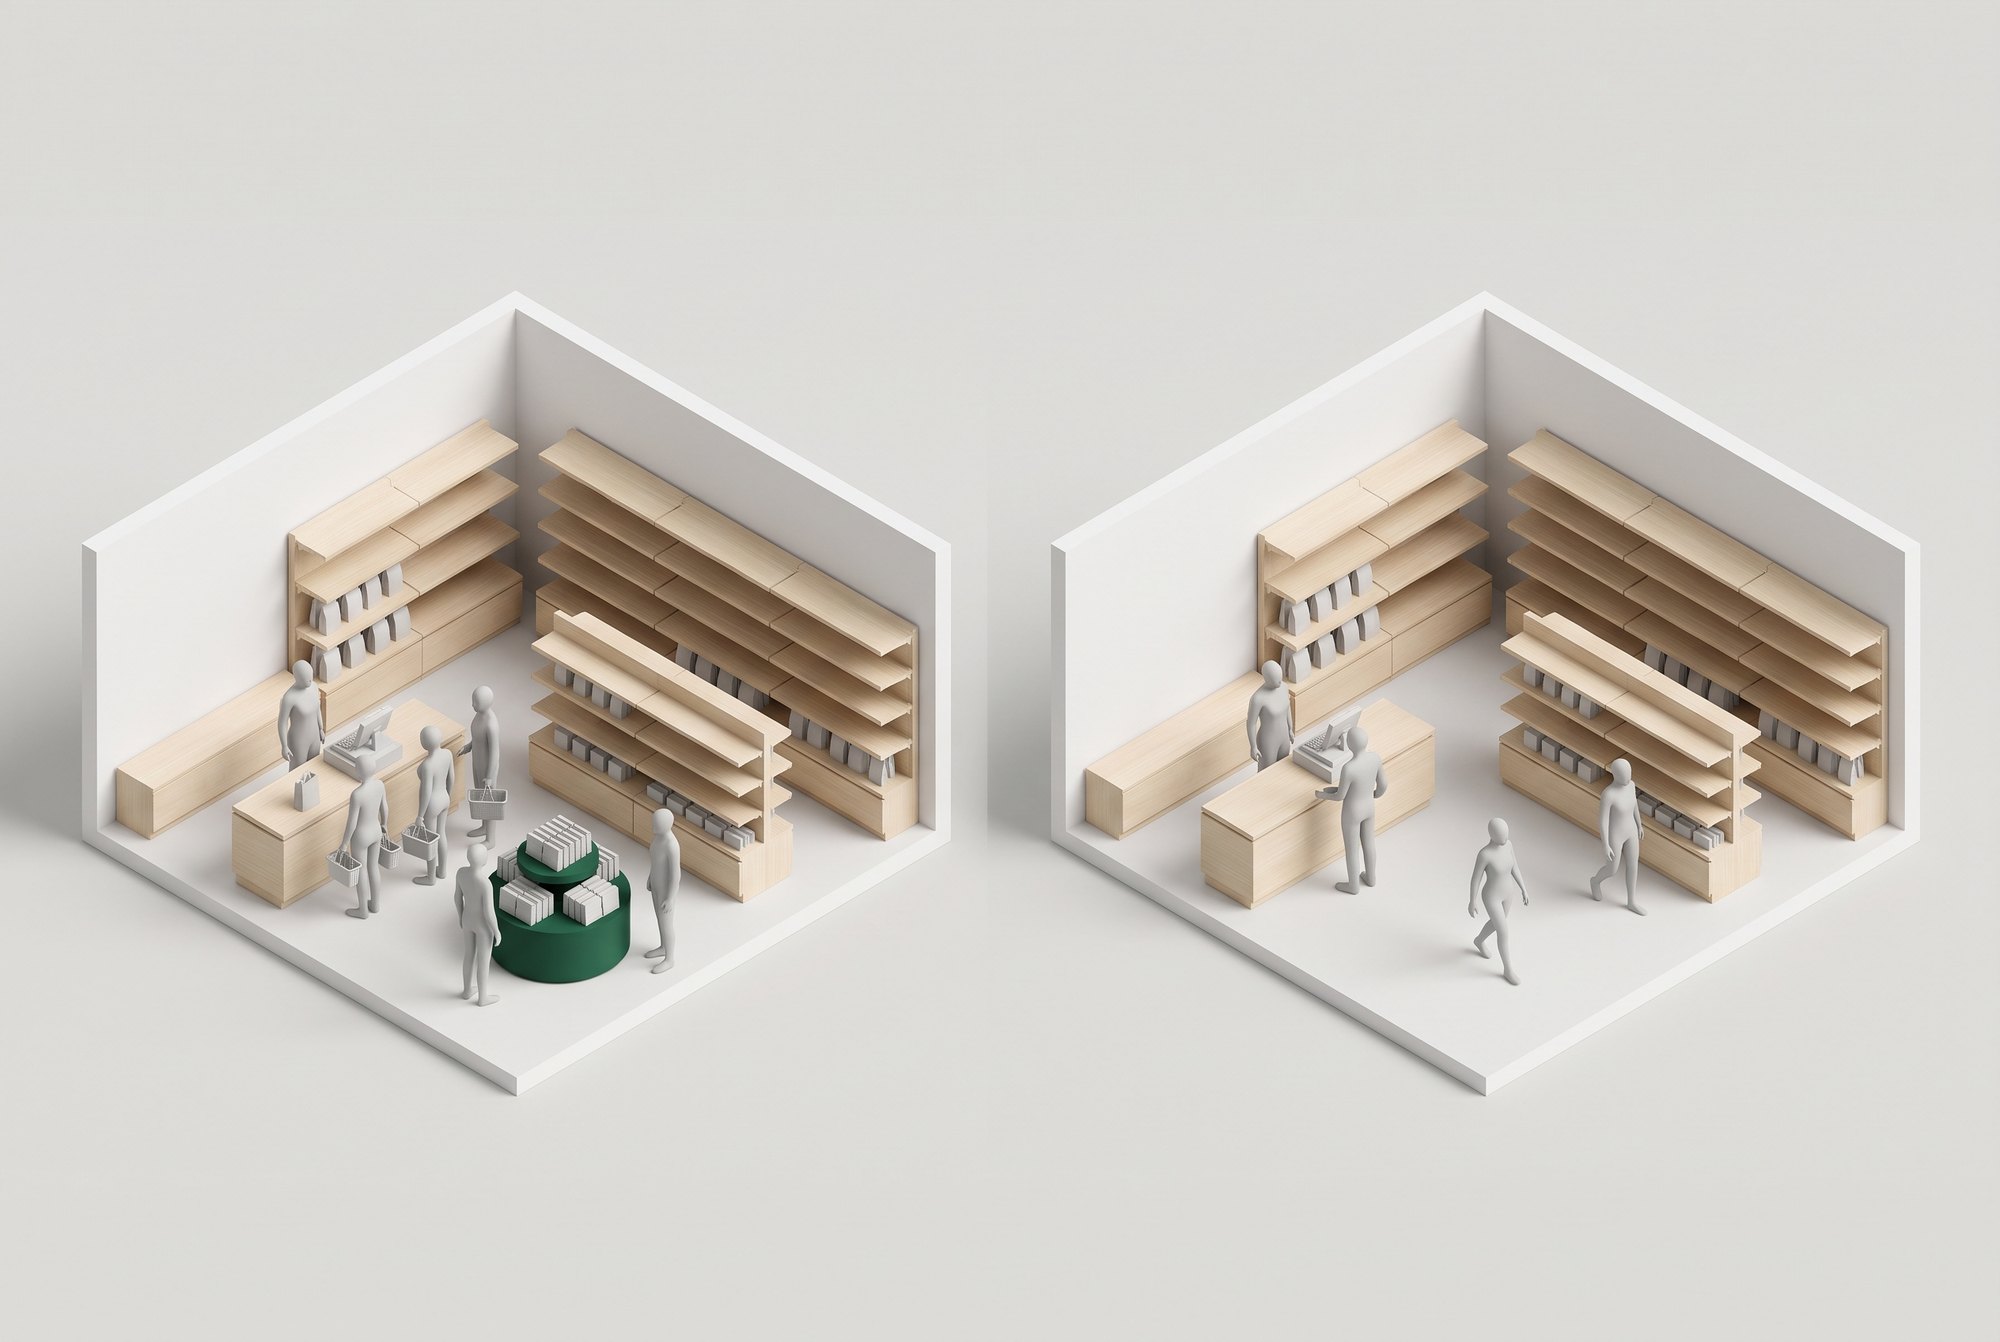
Test store: change applied
Control store: no change
-
Control-store testing
Put the new stand in some stores and not in similar ones. See side by side how many people stopped at it and whether sales changed.
-
Stated accuracy
The counting accuracy of each camera is reported together with the sample size it was measured on. You know how far to trust each figure.
-
Receipt-level matching
The time of each receipt sits next to door entries and the length of the till queue. Conversion is visible by store and by hour.
It reports numbers, not people.
At Visult, privacy is a design rule of the product, not a feature added later. Reports contain no individuals; they contain totals only.
-
No face recognition, no identification
Visult does not determine who anyone is.
-
No scoring of individual staff
Reports compare stores and hours; they contain no evaluation of individual employees.
-
A minimum group size in every report
No figure can be reduced to a single person.
The first report needs no new hardware.
Short recordings from your existing cameras and your till export are enough. Without waiting for an installation or an integration project, you see where you lose buyers in your own stores' data.
-
Camera qualification
Short recordings from the cameras of a few of your stores are assessed for angle, resolution and frame rate. It is clear from the start which cameras can count.
-
Till export
You share the receipt export for the same stores and the same period as a file.
-
First conversion report
Conversion by store and by hour, delivered with the accuracy of each camera.
-
Control-store test
After the first report, a control-store test is set up for a change you choose.
With your legal department. The terms for sharing and processing recordings are agreed together with your chain's legal department.
See where your own stores lose buyers.
No new hardware, no integration project. We start with the cameras and till data you already have.
Schedule a meeting